We are closely monitoring the latest guidance from Public Health Wales and the UK Government regarding the coronavirus outbreak and may amend these engagement monitoring procedures during the academic year as circumstances and University policies and procedures change. We recommend checking these pages regularly to keep up to date with the latest information. Students will also be kept informed of any changes via e-mail.
MyEngagement User Guide
The MyEngagement system is designed to give you an overview of how you are engaging with your studies. Please see the Engagement Monitoring home page for more information on how it allows us to offer you additional support.
Here are some useful tips for how to use and understand the system.
Browser Requirements
The MyEngagement system is best viewed in the following browsers:
• Google Chrome
• Microsoft Edge
• Apple Safari
• Mozilla Firefox
How is engagement calculated in the MyEngagement system?
Your engagement category is calculated based on several different types of digital interactions you have with University systems.
The category will be based on how often you:
- Login to Canvas
- Click to view course content in Canvas
- Access a live online learning session via the Canvas module pages (Zoom)
- View a recorded learning session via the Canvas module pages (Panopto)
- Access library e-resources (Open Athens)
Every time you access one of these resources (such as logging onto Canvas or accessing a live online lecture), MyEngagement will allocate you a number of points. Some interactions are worth more points than others, as we consider them to be more meaningful in tracking your engagement. For example, the points allocated for logging onto Canvas aren't as high as the points for accessing your course content on Canvas. This is because it's more valuable to your learning to view course materials rather than to simply log onto a system. MyEngagement uses this weighted process to look for your system interactions and to calculate your engagement category. There may be a 24-hour delay in your category updating whilst the data is processed by the system.
Can I view attendance at face-to-face learning sessions in the MyEngagement system?
Percentage attendance data at face-to-face learning sessions is not currently available in the MyEngagement system but you will need to swipe your card when attending face-to-face learning sessions and high level card swipe data is available in the Resources section for you to view for information.
Engagement Tab
After logging in, you will be taken to your student record where the Engagement tab will be shown. This presents a summary of your engagement data and shows the last 4 weeks by default.
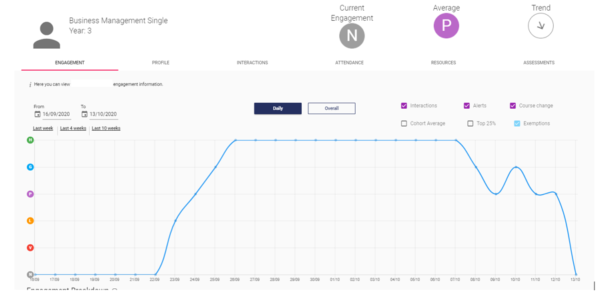
At the top of the page there is a header, which includes information such as your name and course. There are also several indicators, allowing you to see key information at a glance.
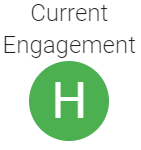
The ‘Current Engagement’ indicator bubble shows your engagement category for the last 24 hours:
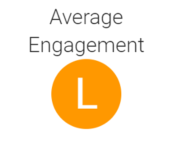
The ‘Average Engagement’ indicator bubble shows your engagement category over the last 30 days:
The engagement categories are:
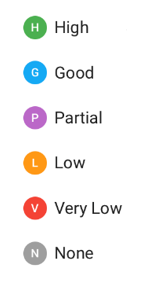
Engagement ratings that fall within the Partial (P), Good (G) and High (H) categories reflect normal and consistent engagement with your course.
Engagement ratings that fall within the Low (L), Very Low (V) and None (N) categories reflect inconsistent engagement and could mean that you may be contacted by your Faculty/School or Student Compliance Services about your engagement, as per the Engagement Monitoring Policy, in order to ensure your welfare and offer support.
The ‘Trend’ indicator bubble displays the direction that your engagement category is taking. A horizontal arrow means the engagement category is consistent, and in this example, it is ascending:
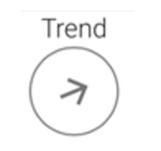
In general, it takes around one week to move either up or down all of the engagement categories but if you don’t use any of the resources at all for a number of days, then you may move through the engagement categories more quickly.
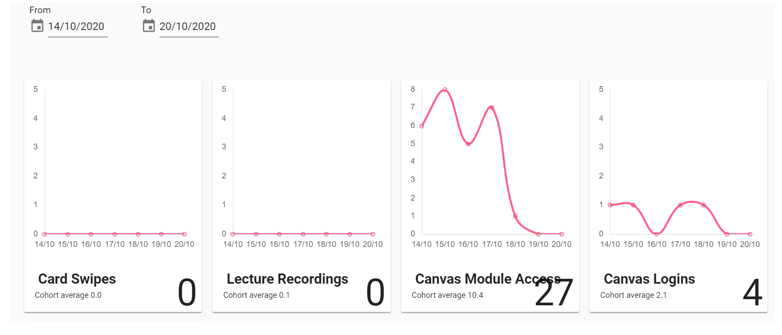
The engagement graph is an interactive display of your activity with the University systems. It updates to reflect the date range chosen in the top left. It can be changed to a daily or overall display by clicking the buttons above the graph:
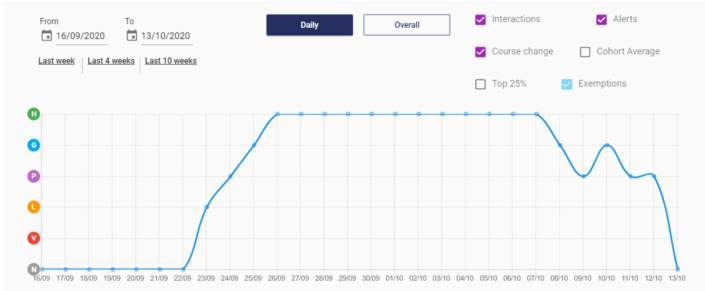
You can use the graph to select different options as follows:
1. Select the date range displayed on the graph between two dates at the top left
2. Select time periods (Last Week, Last 4 Weeks and Last 10 Weeks)
3. Selecting and de-selecting:
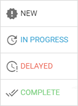
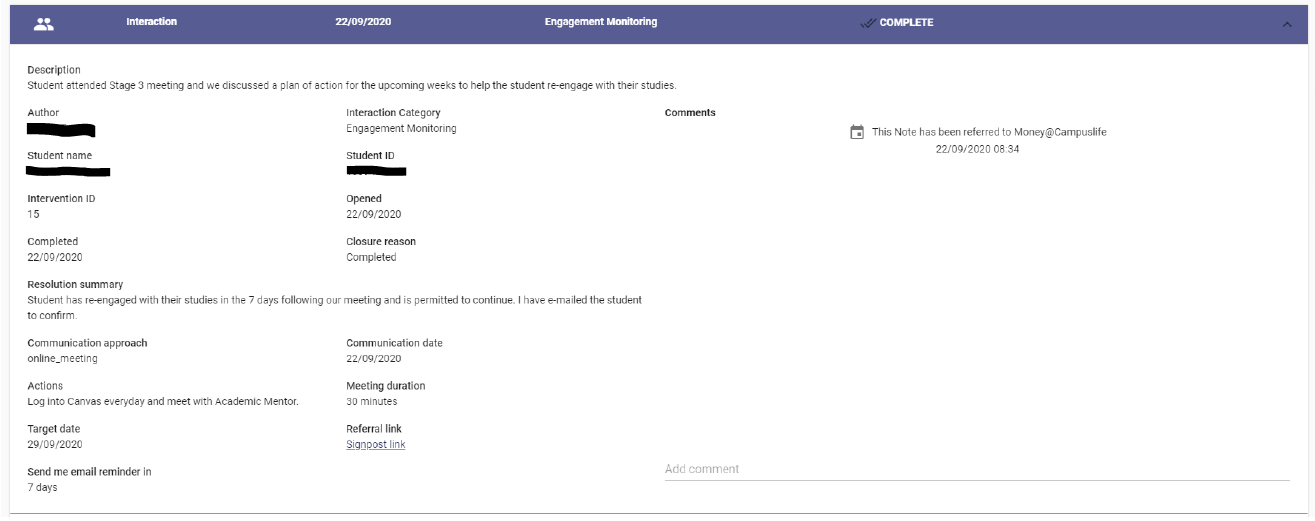
a) Interaction events (i.e. meetings you may have had with your Faculty/School Student Experience Team or Student Compliance Services regarding your engagement)
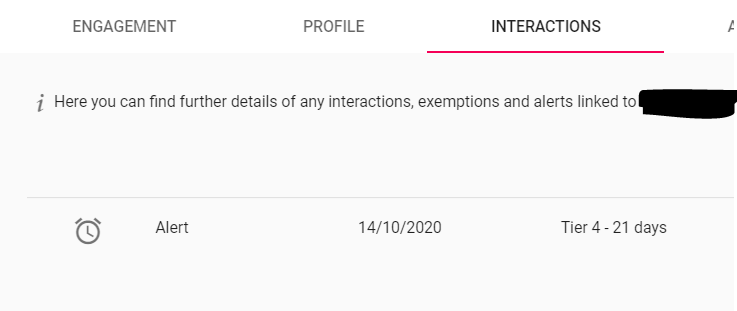
b) Alerts events (i.e. if you have triggered an alert for continuous non-engagement with resources as indicated in the Engagement Monitoring Policy)
c) Course change events (i.e. where you have transferred to a new course)
d) Cohort average engagement line
e) Top 25% engagement line
f) Exemption events (i.e. if you requested a temporary leave of absence that was approved by your Faculty/School)
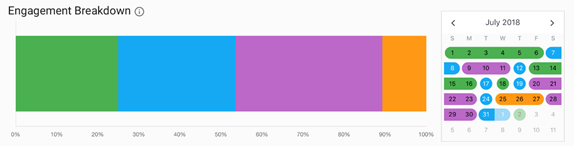
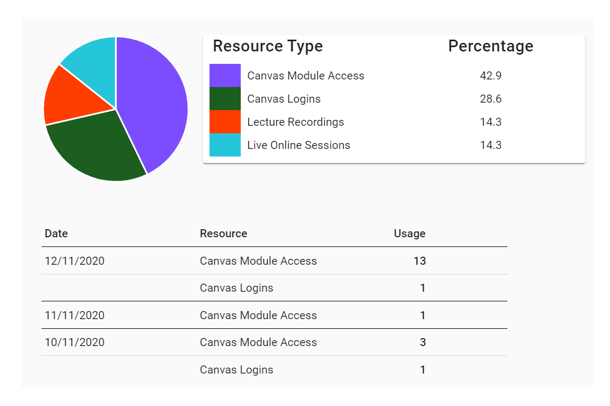
In the bottom right of the Engagement tab there is a rolling calendar that shows all the engagement categories over a monthly period. Next to this, you’ll find the ‘Engagement Breakdown’ bar chart which is designed to provide a visual percentage-based view of how much time you have spent in each engagement category and is defined by the date range selected at the top of the page:
Student Profile Tab
The Student Profile tab is a summary of your personal information arranged in a series of cards.
Interactions Tab
The Interactions tab is a historical list of all your interactions, including:
- Alerts (if you have triggered an alert for continuous low engagement as indicated in the Engagement Monitoring Policy)
- Exemptions (where a temporary leave request has been approved by your Faculty/School)
- Interactions (if you have had a meeting with your Faculty/School Student Experience Team or Student Compliance Services regarding your engagement)
Alerts are sent to students who have no face-to-face engagement over continuous 7-day rolling periods as per the Engagement Monitoring Policy or continuous rolling periods of ‘very low’ or ‘low’ engagement. Your Faculty/School may also set up alerts to track continuous non-engagement over time, such as 14- and 21-day alerts, so that support and guidance can be provided as necessary, and these will also show in your Interactions section if they have been triggered.
The items are listed in date order and display a status indicator:
Clicking on an individual item expands the record to provide a more detailed view:
Attendance Tab
Percentage attendance data at face-to-face learning sessions is not currently available in the MyEngagement system but you will need to swipe your card when attending face-to-face learning sessions and high level card swipe data is available in the Resources section for you to view for information.
You can also view more detailed information about your card swipe data in the MyAttendance system.
Resources Tab
The Resources tab displays a range of data sources that represent participation with teaching and learning. The data sets you will see are as follows:
- Canvas Logins
- Canvas Module Access
- Lecture Recordings (Panopto)
- Live Online Lecture/Seminar Sessions (Zoom)
- Library E-resources (Open Athens)
- Card Swipes
Card swipe data is not currently used to calculate your engagement rating in the system, but is displayed here for information. Students who are attending face-to-face sessions should swipe their card when entering face-to-face teaching sessions as per their timetable.
The different data sets listed are weighted differently and contribute differently to the engagement category. You can change the from and to dates in the top left-hand side of the page to view your usage of each of the items over a chosen date range.
A pie chart showing the importance of each of the resource types when calculating your engagement rating and an activity summary table are shown towards the bottom of the screen for further information:
Assessments Tab
Assessment data is not currently available in the MyEngagement system. Please visit your Intranet account to view assessment data.
User Selection
Clicking on the user selection menu icon at the top right of the screen opens the drop-down menu allowing you to configure MyEngagement to suit your needs. The menu includes:
- Language – You can select to change the language to Welsh
- Dark Theme – selects the dark theme
- Logout – exits the application
Help Button
Clicking on the Help button on the right-hand side of the screen will display URL links for further support available at the University:
FAQs
In the top header there is an FAQ tab:
Clicking on this will display a list of FAQs that can be read along with the information provided on this page and our Engagement Monitoring pages.